Project analysis
The goal of Project analysis is to display in real-time (i.e. updated continuously when building a planogram) various metrics based on your product properties, your planogram arrangement and real-world market data such as pricing and sales.
This enables you to check your planogram performance as a whole and per product.
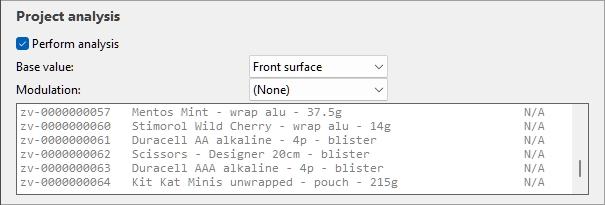
Here is a typical workflow to analyze your current project:
- Perform analysis.
- Adjust Base value and Modulation.
- See the complete results in the Results log (Project analysis).
- Optionally also display the analysis results as various indications on screen:
- Project analysis value in Project item list.
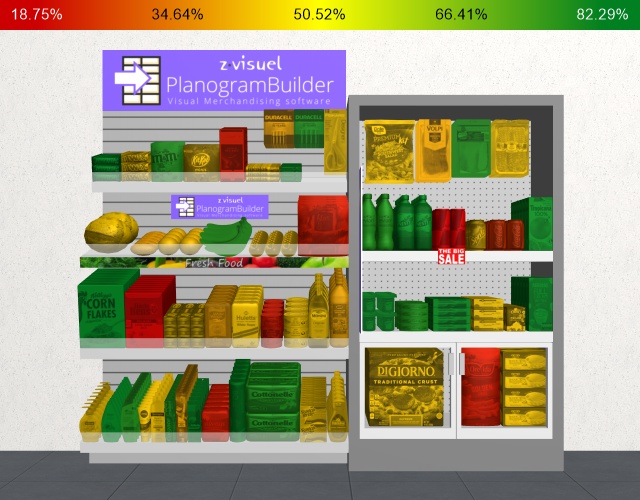
- Highlight (Colored highlights) on products in the visualization area and in Project item list.
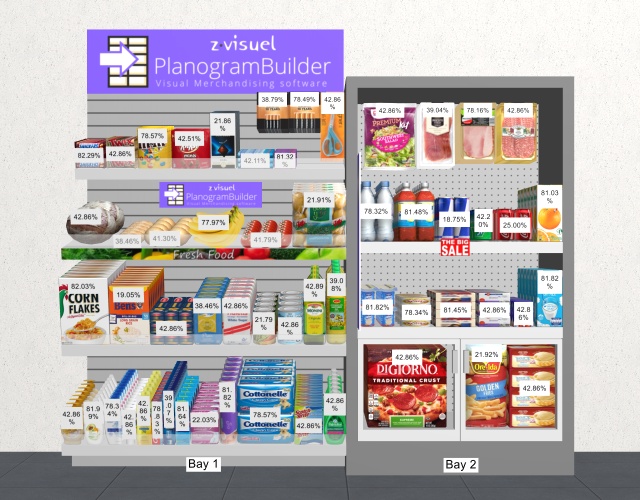
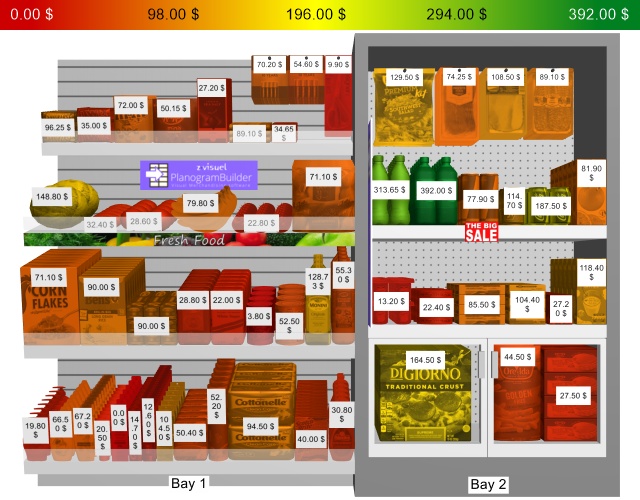
- Content of labels on products in the visualization area in Schematic view.
Examples of combinations displaying the analysis results as colored highlights, with product labels and in schematic mode:
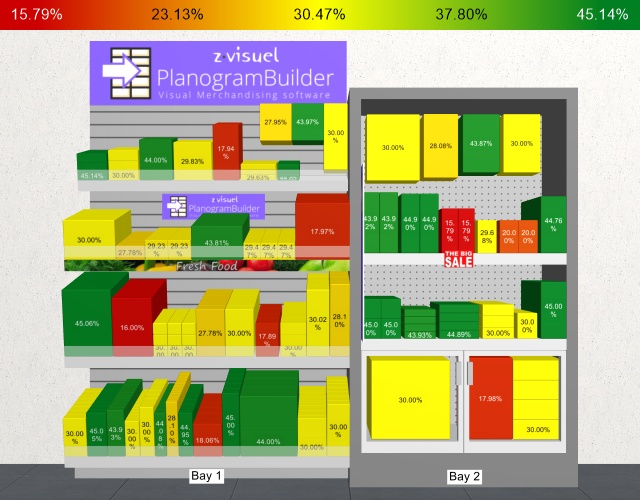
Commands (Project analysis)
Perform analysis
Toggles the activation of the analysis calculations.
- Supported values:
- Checkmarked: Project analysis is active.
- Not checkmarked: Project analysis is not active.
- Default value: Not checkmarked
Note: the analysis is performed for each product reference found in the current project. If a given product reference is found at several locations in your planogram, the analysis result for this product combines all its occurrences.
Parameters (Project analysis)
The analysis can be configured with the parameters below.
Base value
This drop-down list lets you choose the main criteria to perform the project analysis.
- Supported values:
- Front surface: Consult Front surface [Measurement unit2].
- Linear space: Consult Linear space [Measurement unit].
- Markup Sales: Consult Markup [Currency symbol] (Sales value).
- Markup On shelf: Consult Markup [Currency symbol] (Shelf value).
- Markup percent: Consult Markup percent [Currency symbol] (Shelf value).
- Quantity sold: Consult Quantity sold (Sales figures file).
- Profit margin: Consult Profit margin [Currency symbol] (Shelf value).
- Retail value (tax excl.) Sales: Consult Retail value (tax excl.) [Currency symbol] (Sales value).
- Retail value (tax excl.) On shelf: Consult Retail value (tax excl.) [Currency symbol] (Shelf value).
- Retail value (tax incl.) Sales: Consult Retail value (tax incl.) [Currency symbol] (Sales value).
- Retail value (tax incl.) On shelf: Consult Retail value (tax incl.) [Currency symbol] (Shelf value).
- Sales tax rate: Consult Sales tax rate.
- Single item markup: Consult Single item markup.
- Retail price (tax excl.): Consult Retail price (tax excl.).
- Retail price (tax incl.): Consult Retail price (tax incl.).
- Buying price: Consult Buying price.
- Volume used: Consult Volume used [Measurement unit3].
- Buying value Sales: Consult Buying value [Currency symbol] (Sales value).
- Buying value On shelf: Consult Buying value [Currency symbol] (Shelf value).
- Default value: Front surface
Modulation
Depending on Base value, you can modulate the analysis result to take into account the quantity on shelf or the space used by the products in your current project.
This is useful for example to perform space versus sales analysis.
- Supported values:
(None) (Project analysis)
Shows the direct results of the analysis selected in Base value (no modulation applied).
Per front facing
Divides the results of Base value by the number of products in the block seen from the front.
|
|
Result of analysis (Base value) |
|
/ |
|
|
= |
Result (Per front facing) |
Per linear space
Divides the results of Base value by the width used by the product block.
|
|
Result of analysis (Base value) |
|
/ |
|
|
= |
Result of analysis (Per linear space) |
Per front surface
Divides the results of Base value by the front surface used by the product block.
|
|
Result of analysis (Base value) |
|
/ |
|
|
= |
Result of analysis (Per front surface) |
Per volume used
Divides the results of Base value by the volume used by the product block.
|
|
Result of analysis (Base value) |
|
/ |
|
|
= |
Result of analysis (Per volume used) |
- Default value: (None)
Results log (Project analysis)
This is the text area where results of the analysis are shown, listing one product per line with its value.

The total and average values for your project are also displayed on the last line when applicable.
The text color of each line represents the product value on a graded scale, using the same colors as when highlighting products based on the analysis results (Highlight by… > Project analysis value).
Tip: you can zoom in/out in the log window using Ctrl + mouse wheel. The default zoom level is reset upon task switching.
Notes:
- Undefined metrics are displayed with the N/A value.
- Metrics based on incomplete data have the (MD) (missing data) value appended to the calculated value.
Log context menu (Project analysis)
Right-click in the log area to see its context menu.
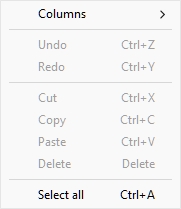
The following tools and options are available:
- Columns: lets you choose the columns to display in the log:
- Reference: a column with Reference of each product.
- Name: a column with Name (Item properties) of each product.
- Value: a column with the result of the analysis.
- Copy: lets you copy selected text from the log (Ctrl + c).
- Select all: selects all the text in the log (Ctrl + a).
Tip: to preserve the text colors and format when you paste the analysis results in another application, choose the paste methods labeled Rich Text Format, formatted text RTF or Keep format.