Reports
You can publish your planograms as detailed reports which include the list of items in your project as well as optional predefined image(s) of the planogram.
Reports can be saved in common file formats such as PDF and are well suited for printing and transmitting your planogramming guidelines for implementation.
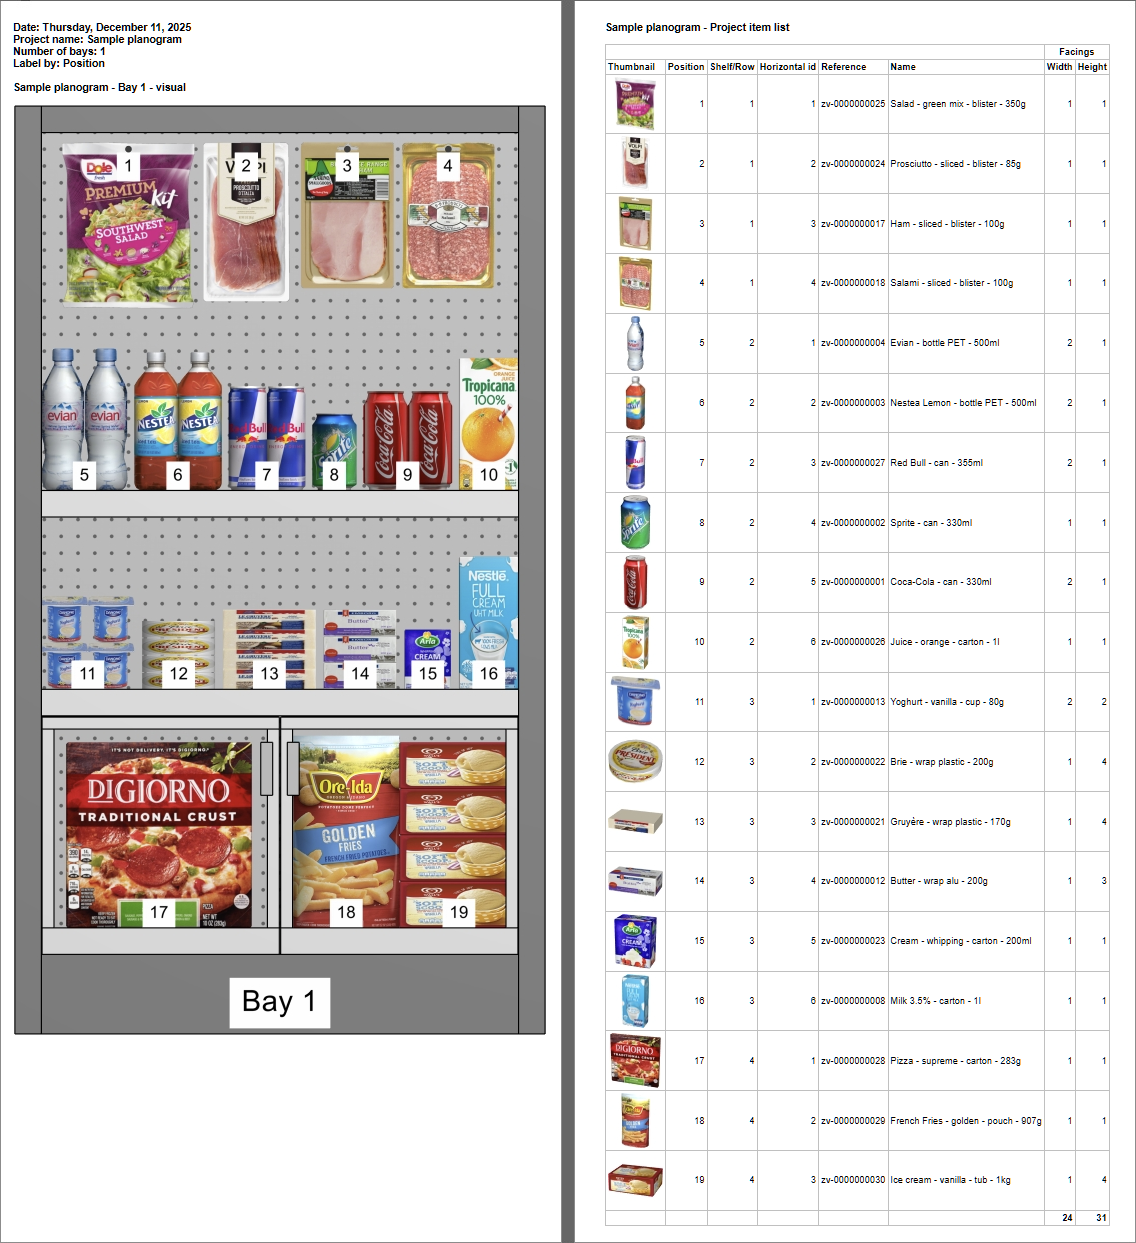
Example of Reports
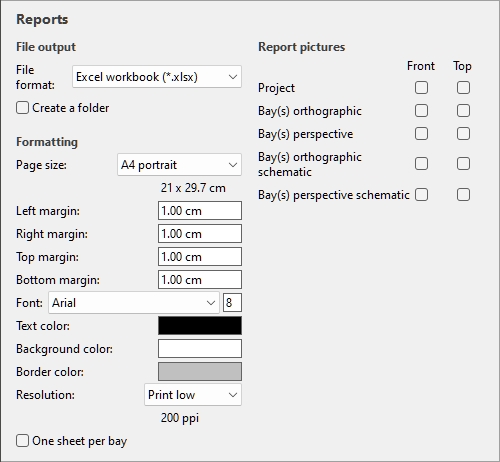
Parameters (Reports)
In this pane, you can configure your reports for output.
Advice: once the report is configured, use the dedicated command to save it (Report).
Title of the report
The title of your reports is automatically generated and contains the following information:
- Date: ... (the date of the report, which can be different from the project date)
- Project name: the name you assigned when saving the project. cf. Name (Project properties).
- Number of bays: the number of individual pieces of furniture
- Group by: the property by which items are grouped. This is displayed if Group (toggle) is active except if Group by… is by Bay number or by Bay name.
- Highlight by: the property by which items are highlighted. This is displayed if Highlight (toggle) is active.
- Label by: the property by which items are labeled. This is displayed if Content (Labels) is not empty and at least one picture in Report pictures has View labels checkmarked under View toggles (Report pictures).
File output
Under this section, you can configure file output for reports.
File format (Reports)
The file format to save the report.
- Supported values:
- HTML (*.html): (Hypertext Markup Language). A file with separate image files in jpeg format (planogram pictures and item thumbnails). Choose this format to:
- Publish the report and images “as is” directly on an Intranet or Internet web site.
- Open in Microsoft ® Word for further editing and printing. Once opened in Word, you can also save as PDF, DOC or DOCX documents, which regroups the otherwise separate listing and images of the report in one single file.
- Excel workbook (*.xlsx): (Microsoft ® Excel workbook). Choose this format to:
- Open and edit the planogram product listing in a spreadsheet application.
- Notes:
- When printing the report from Excel, if the list is too wide to fit within the selected page size, additional pages are generated for the extra columns.
- Planogram images and item thumbnails are embedded in Excel files.
- In this format, any group (Group) shown in collapsed state in Project item list is also collapsed in the Excel report list. It can be expanded if desired in Excel using the plus (+) symbol.
- Excel 97-2003 workbook (*.xls): the older Excel file format. Use this for compatibility if necessary.
- PDF (*.pdf): (Portable Document Format). Choose this format to:
- Obtain the report and images in a format ready to print or send to others.
- Notes:
- Do not choose this format if you want to further edit the report layout or content.
- In this format, if the listing columns are too wide for the selected page size, additional pages are generated for the extra columns.
- Planogram pictures and item thumbnails are embedded in PDF files.
- Default value: HTML (*.html)
Create a folder
Toggles the creation of a new folder in which to save the report.
- Supported values:
- Checkmarked: a new folder is automatically created when you save a report. The folder is created within the folder selected in the Save dialog box and is named with the same name as the report name.
- Not checkmarked: no new folder is created when you save a report. The report is saved directly in the folder specified when saving it.
- Default value: Not checkmarked
Layout
The settings below provide diverse options to customize the layout of your reports.
Page size
A list of predefined values defining the dimensions of the pages in the report. This list includes common and custom page sizes.
- Supported values:
- A3 landscape
- A3 portrait
- A4 landscape
- A4 portrait
- Ledger (landscape)
- Legal landscape
- Legal portrait
- Letter landscape
- Letter portrait
- Tabloid (portrait)
- Custom: if you don’t find a suitable preset value, choose this and set your own page width and height values in the text box which appears below. Enter values as follows: width x height unit (cm / mm / m / in). Use the letter "x" to specify the multiplication symbol. If no unit type is entered, it defaults to your current choice of Measurement unit as set in the application settings.
- Default value: A4 portrait
- Example: 18 x 24 cm
Notes:
- Page size for PDF format is well supported.
- When you open an HTML report in a web browser, the page size doesn’t have any effect when just viewing the report. Page size is only used to determine page layout for printing the reports from web browsers or when opening in paper-based applications like Microsoft ® Word.
- The page size for HTML and Excel formats are recognized only by some web browsers and applications, as shown in the table below:
|
|
Microsoft ® Word |
Microsoft ® Excel |
Microsoft ® Edge |
Google Chrome |
Mozilla Firefox |
|
Page size support |
Yes |
No |
Yes |
Yes |
No |
- In case page size is not supported, you must set the page layout manually in your application when you want to print a report, from Excel for example.
Left margin (Reports)
The width of the left margin in the report.
- Supported values: positive numeric value [0-9 and decimal point] (based on Measurement unit)
- Default value: 0
- Example: 15
Right margin (Reports)
The width of the right margin in the report in the current choice of Measurement unit.
Top margin (Reports)
The height of the top margin in the report in the current choice of Measurement unit.
Bottom margin (Reports)
The height of the bottom margin in the report in the current choice of Measurement unit.
Style
The settings below provide diverse options to customize the colors and fonts of your reports.
Font (Reports)
Sets the typeface and its size of the text for product listings in reports. The report titles are also scaled based on the selected value.
- Supported values for the typeface: fonts installed on your computer.
- Supported values for the size: positive integer numeric values [0-9] corresponding to font point size. Maximum 100 points.
- Default value: Arial, 8
- Example: Tahoma, 14
Advice: If your report lists don't fit on the page, try to select a smaller font size.
Text color (Reports)
The color of texts in reports.
- Supported values: any color picked from the color palette.
- Default value: black
- Example: blue
Instructions:
- Click on the color sample on the right of Text color.
- Pick any color from the color palette.
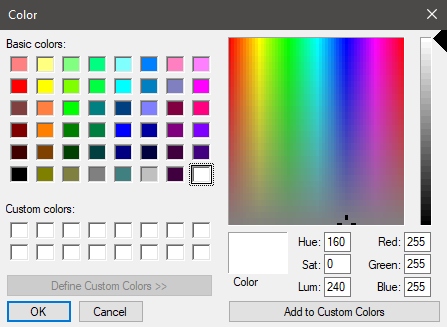
- Click OK to confirm.
Background color (Reports)
The color of the page background for reports.
- Supported values: any color picked from the color palette.
- Default value: white
- Example: yellow
Instructions:
- Click on the color sample on the right of Background color.
- Pick any color from the color palette.
- Click OK to confirm.
Border color (Reports)
The color of borders for the tables containing product listings.
- Supported values: any color picked from the color palette.
- Default value: silver
- Example: dark grey
Instructions:
- Click on the color sample on the right of Border color.
- Pick any color from the color palette.
- Click OK to confirm.
One sheet per bay
Toggles the layout of reports between one and multiple Excel sheets.
- This option is only available if both following conditions are met:
-
- an Excel file format was chosen. cf. File format (Reports).
- Group by… Bay number or by Bay name is applied in Project item list.
- Supported values:
- Checkmarked: the Excel report is split into separate sheets for each bay. Each sheet includes the images (Report pictures) and the list of items (Project item list) for a single bay. In case you haven’t defined Project pictures, the project title is also shown on each sheet.
- Not checkmarked: the whole Excel report is shown on a single sheet, which includes the images (Report pictures) and the list of items (Project item list) for all bays in the project. Images and lists are ordered vertically from the first bay at the top, to the last bay at the bottom of the sheet.
- Default value: Not checkmarked
Report pictures
You can include two types of pictures in your report: Project pictures and Bay pictures.
These images are different from Single pictures: report images can be set to predefined viewpoints and are automatically cropped and zoomed to fit your planogram nicely in the report.
You can add and configure multiple pictures to include in your reports.
Resolution (Report pictures)
The resolution in pixels per inch (PPI) for all images in a report. Several preset choices are available, and you can also enter a custom value. The higher the setting, the more detailed your images will be. It’s useful when you zoom in or when you print them. The tradeoff of a higher resolution is a larger file size.
- Supported values:
-
- Screen: (96 ppi). This corresponds to the Windows system ppi with a screen scaling at 100%. Suitable for reports that are displayed on low-dpi screens that won't be zoomed in.
- Print low: (200 ppi). Suitable for low quality printing or onscreen reports.
- Print medium: (300 ppi). Recommended for reports that will be printed.
- Print high: (600 ppi). Recommended for reports that you want to print in high-resolution.
- Custom: you can specify any values up to 1000 ppi. Note that you don't have to enter ppi after the value.
- Default value: Print low
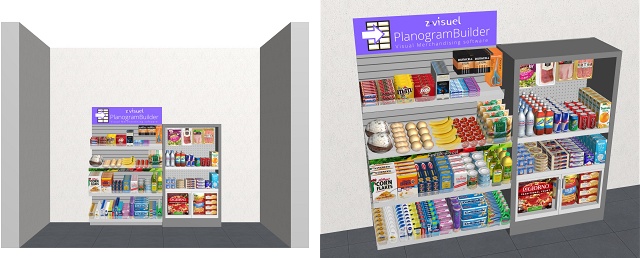
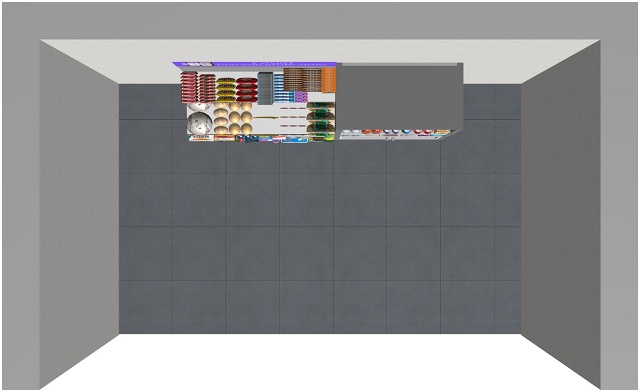
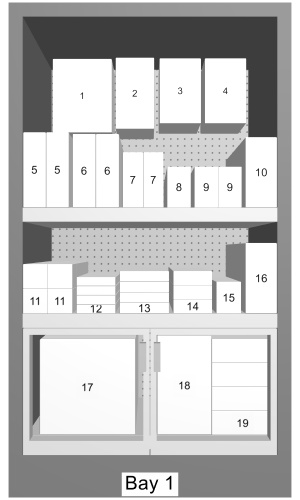
Project pictures
Images showing your entire planogram in the report, displayed just below the report title.
This is useful if you have a room or several bays in your planogram project.
Examples:
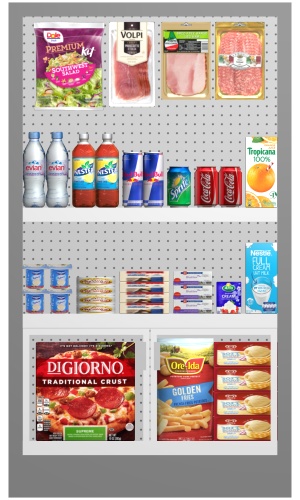
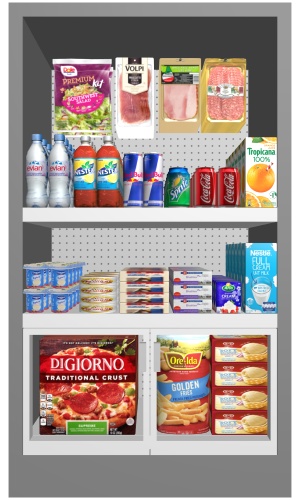
Bay pictures
Images showing each bay in the report. This lets you have a clear image of the products on each bay.
These pictures are displayed at different locations in the report depending on the following criteria:
- The images are located just above the list of items of the corresponding bay if the products and / or accessories are grouped by one of the following properties in Project item list > Group: Bay number, Bay name, Bay - Shelf. Advice: This is very convenient to obtain a report with a separate section for each bay (with its images and its list of products).
- Otherwise, the images are located above the list of items of the whole project.
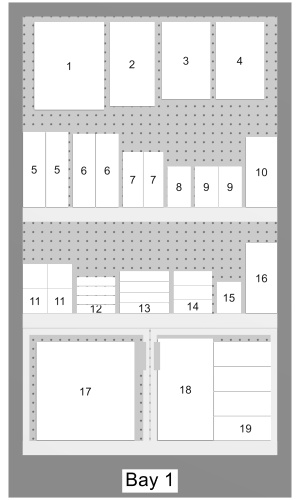
Advice: To easily find each product in the report images and in the item listings:
- Checkmark View labels in Properties (Report pictures).
- Checkmark Location in the list of label properties in Visualization > View > Labels > Content.
- Also, checkmark Location under Columns, in Content choice (Project item list).
Examples:
Managing report pictures
For both types of pictures (Project pictures, Bay pictures), each picture is represented as a white tile with its picture title. Example:
![]()
Add a report picture
- Click on the plus sign (+) under the desired picture type (Project pictures or Bay pictures).
- A dialog opens showing the picture properties.
- Checkmark the desired parameters. cf. Properties (Report pictures) for details on the available choices.
- Enter a title for the picture, for example: perspective front. cf. Picture title for details.
- Click OK to validate.
- The new picture appears as a white tile below the chosen picture type.
Modify a report picture
- Click on its white tile.
- A dialog opens showing the picture properties.
- Change the desired parameters. cf. Properties (Report pictures) for details on the available choices.
- Change the title if desired.
- Click OK to validate.
- The updated picture parameters are saved and its tile reflects its updated title if applicable.
Re-order report pictures
- Grab the two horizontal lines on the left of a picture tile, then move it above or below another picture tile.
- The tile is repositioned and the order of pictures changed in the report.
Delete a report picture
- Click on the X on the right of its tile.
Properties (Report pictures)
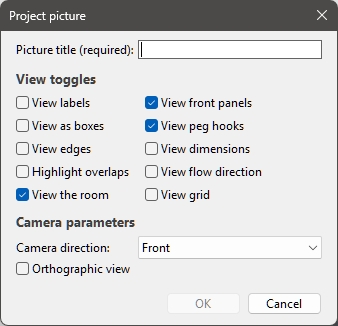
The following parameters are available for Project pictures:
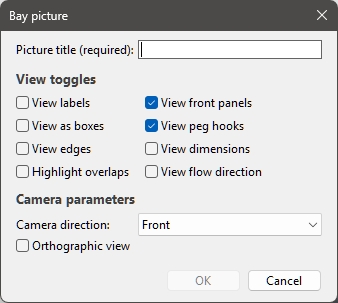
The following parameters are available for Bay pictures:
Picture title
A compulsory user-defined descriptive title for the picture.
- Supported values: text, including Unicode characters for non-Latin text values
- Default value: empty. Note: a title must be entered, otherwise the picture cannot be created.
- Example: schematic picture
Note: In the published report, the picture title will be displayed above the corresponding picture(s), and is automatically prefixed by the project name (Name (Project properties)) and by the type of picture (Project or BayProject pictures). Example: My latest Planogram - Bay – perspective front
View toggles (Report pictures)
The viewing options for the selected picture. The proposed choices have the same effect as those described in Tools and commands (View), except they affect the picture in the report instead of the interactive view in PlanogramBuilder. For example, you can hide the dimensions in a report picture, but show them in the visualization area while editing your planogram.
- Supported values:
cf. each of the above links for a description.
- Default values: your current choices for the corresponding toggles in View parameters (visualization area) are used.
Camera parameters (Report pictures)
This viewing angle and perspective options for the selected report picture.
Camera direction
Sets the viewpoint from which your picture is seen.
- Supported values:
-
- Current direction (only for Project pictures): applies the same camera angle as is currently used in the visualization area.
- Automatic (only for Bay pictures): this choice sets the viewing direction of each picture independently according to the types of shelves and back panels of each bay:
-
- A front view is used if the bay contains no back panel and no shelf, or if it contains only back panels and / or shelves of the following type: Gondola shelf.
- A top view is used if the bay contains only shelves of the following types: Table top, Refrigerated chest
- A 45° Front view is used otherwise (if the bay contains a mix of the above)
-
- Front: the project or bay is shown from the front.
- 45° Front: the project or bay is shown from an angle in between front and top.
- Top: the project or bay is shown from the top.
- Left: the project or bay is shown from the left.
- Right: the project or bay is shown from the right.
- Back: the project or bay is shown from the rear.
- Default value: Front
Orthographic view (Report pictures)
Toggles the perspective effect in the report picture. This has the same effect as Orthographic view, but applies to the selected report picture(s) only, not to the interactive visualization.
- Supported values:
- Pressed (checkmarked): the picture is displayed in orthographic mode.
- Not pressed (not checkmarked): the picture is displayed in perspective mode.
- Default value: your current choice from Orthographic view (Camera parameters) (visualization area) is used.
Notes (Report pictures)
- Image dimensions are maximum 10000 pixels in width and 10000 pixels in height. Images resulting in higher pixel width or height based on the chosen Page size and Resolution (Report pictures) are clamped down to the maximum allowed pixels.
- If View dimensions is checkmarked for a picture, dimension text and arrows are adjusted automatically to result in a text height of 3 mm in your printed images. This does not correspond to the text size of dimensions in the visualization area.
- If View dimensions is checkmarked for a picture, the type of dimension shown in the report images varies depending on the type of picture:
- Project pictures:
-
- These images include the dimensions of each cluster of shelving (each isolated bay and each group of adjacent bays).
- Dimensions of room elements, products and accessories are not shown.
- The width, height and depth are displayed depending on the viewing angle and the available space for dimensioning.
- Bay pictures:
-
- These images include bay dimensions, plus vertical shelf measures and lateral distances between Dividing panel.
- The width, height and depth are displayed depending on the viewing angle and the available space for dimensioning. For example, front views only show width and height; top views only show width and depth.
List of items (Reports)
Reports also include the list of all the products and / or accessories used in a project.
The report list reflects Project item list. For this reason, Project item list is always displayed in this task (Publish).
Make sure to configure Project item list to obtain the desired layout and content for the list of items in your reports. We advise saving Presets (Project item list) for diverse needs.
Notes on groups in report lists:
- If items are not grouped in Project item list, the report contains a single list with all items. (cf. Group)
- The report contains a separate item list for each bay in the report if you have grouped items by the following properties: Bay name or Bay number.
- If you have grouped items by any other property (e.g., category), the report contains a single list with all items. Additional rows with a distinct color show the name of each group (e.g., beverage). See below example:
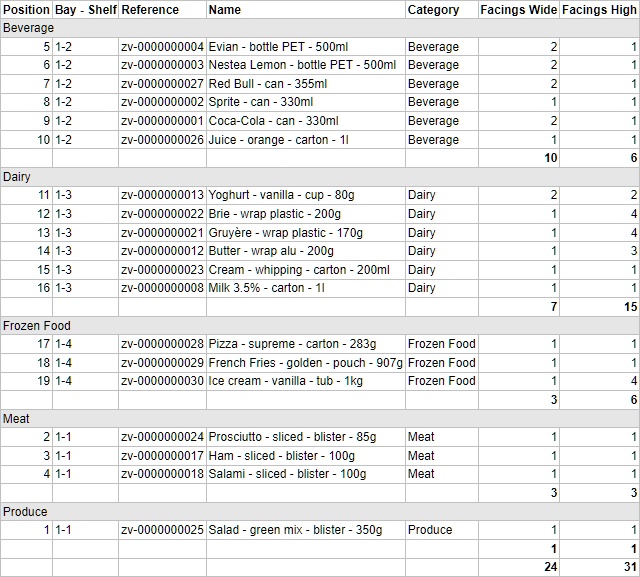
Example of a report list in Microsoft Excel format.
Tools and commands (Reports)
The toolbar at the bottom of this pane contains one command to save Reports.

Report
Saves a report with a list of items and optional images of your project to your local hard disk.
Notes:
- cf. Reports for the description, examples and instructions to configure the report and file format.
- The status bar indicates when the report is ready.