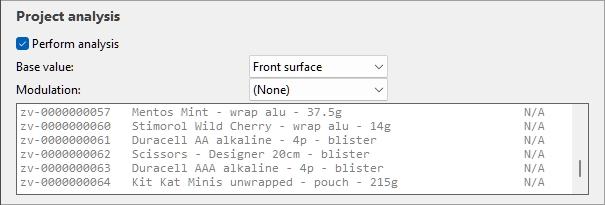
Project analysis
In Project analysis, you can define custom metrics to measure your planogram performance as a whole and per product.
Custom metrics (Project analysis)
Each custom metric combines two metrics related to sales, pricing or space usage. The primary metric value is divided by the scaling metric value to obtain the resulting vales.
Examples:
- A custom metric that calculates the retail value (tax excl.) on shelf per front facings:
|
|
Shelf value > Retail value (tax excl.) |
|
/ |
Facings front |
|
= |
Resulting value |
- A custom metric that calculates the sales revenue per linear space:
|
|
Sales value |
|
/ |
|
|
= |
Result value |
Notes:
- Undefined metrics are displayed with the N/A value.
- Metrics based on incomplete data have the (MD) (missing data) value appended to the calculated value.
Once a custom metric has been defined, its values for each product can be displayed in:
- Project item list and Reports: custom metrics available in Content choice (Project item list). Note: The total and average values for your project are also displayed on the last line when applicable.
- Highlight: custom metrics available in Highlight by…
- Labels: custom metrics available in Content (Labels)
Examples of displaying values of custom metrics:
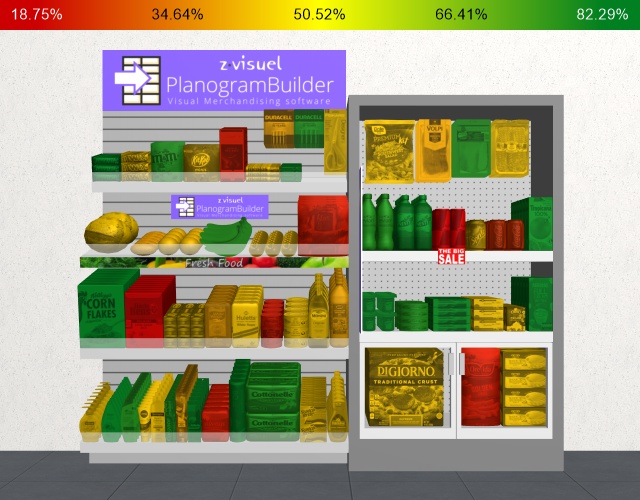
Values of a custom metric shown as colored highlights
Values of a custom metric shown as product labels
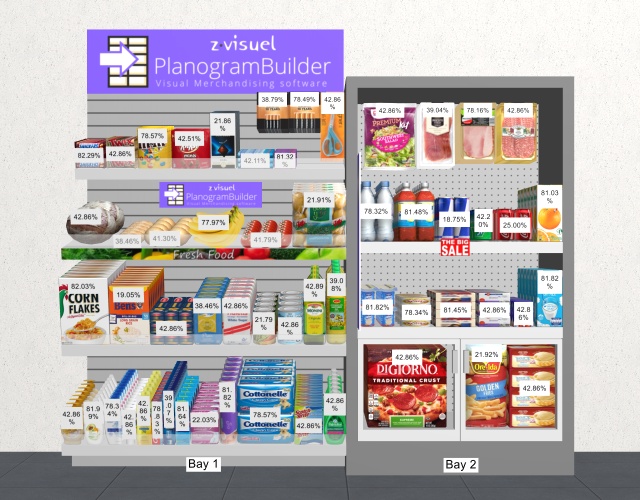
Values of a custom metric shown as products labels and colored highlights
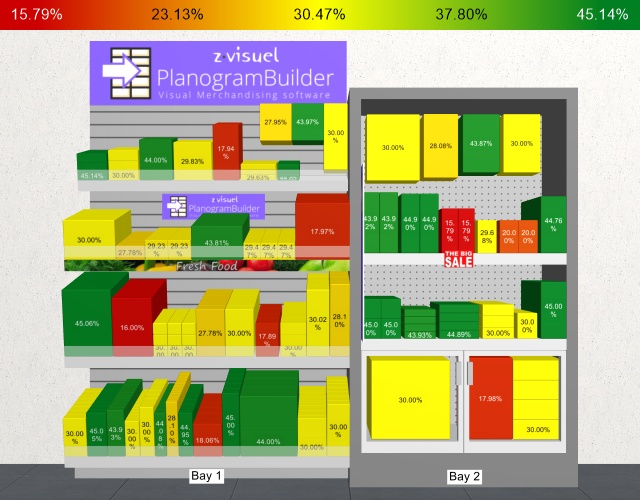
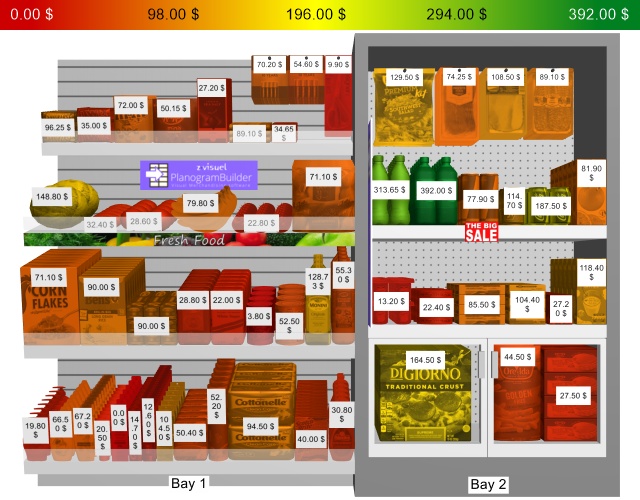
Values of a custom metric shown as products labels and colored highlights with products displayed as boxes
Manage custom metrics
Here are the instructions to create, modify and delete custom metrics.
Each custom metric is represented by a white tile such as this example:
![]()
Define a custom metric
- Click on the button with a + sign.
- A dialog opens showing the custom metric properties.
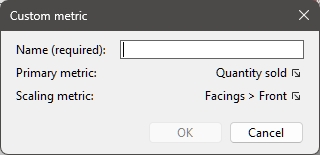
- On the right of Primary metricPrimary metric, click on the current metric to open the available choices.
- Make a choice amongst the metrics available for Primary metric.
- On the right of Scaling metricPrimary metric, click on the current metric to open the available choices.
- Make a choice amongst the metrics available for Scaling metric.
- Enter a name for the metric, for example: sales value per linear space.
- Click OK to validate.
- for details on each available property, since the same choices are described there.
- The dialog window closes.
- The newly created custom metric is now available and represented by a new tile such as this one:
![]()
Modify a custom metric
- Click on a custom metric tile name.
- Proceed as described here: Define a custom metric.
Re-order custom metrics
- If you have several tiles, grab the two lines on the tile and drag it up or down.
- The tile is repositioned and the order changed.
- The order of the custom metrics allows you to place the one most important to you at the top of the list, but has no other effect.
Delete a custom metric
- Click on the X on the tile.
- The tile is deleted.
- The custom metric is no longer available.
Custom metric parameters
Name (Custom metric)
A user-defined descriptive name for the metric, for example: sales revenue per linear space
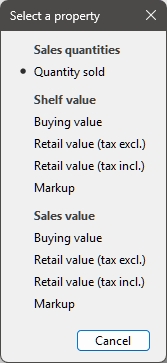
Primary metric
This list lets you choose the main criteria to perform the project analysis.
- Supported values:
- Sales quantities
-
- Quantity sold: cf. Quantity sold (Sales figures file).
- Shelf value
- Sales value
- Default value: Quantity sold
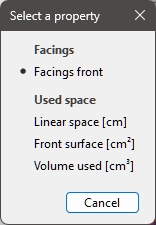
Scaling metric
The scaling metric is used as the divisor of the primary metric values to scale the results based on the quantity or the space used by of each product in your current project.
This is useful for example to perform space versus sales analysis.
- Supported values:
- Default value: Facings front