Assortment analysis
Assortment analysis lets you define a subset of the products in your database.
You can then optionally rank and filter this subset by sales and by classification to optimize your planogram assortment, with the performance of each product displayed in Results log (Assortment analysis). The analysis results can also be used to filter and sort the products in Catalog of products.
One of the typical use cases is applying the Pareto principle to identify the most valuable products.
Here is a typical workflow to perform an assortment analysis:
- Define and load the desired list of products to analyze (Assortment file).
- Set the analysis Parameters (Performance criterion, Inclusion threshold, Restrict to catalog filters). Depending on your choice of Performance criterion, you may also need Price list file and Sales figures file.
- See the complete analysis results in Results log (Assortment analysis).
- Optionally rank and filter the Product catalog based on the analysis results (Assortment (mode in Catalog of products).
Assortment file
A file defining the list of products you want to analyze.
It can contain all or a subset of the products in your database, each listed by Reference.
Products not found in your database and disabled products (consult Enabled) are disregarded by the analysis.
- Supported file formats: Microsoft Excel (*.xls or *.xlsx)
- Example file: you can download the following file listing the products in all food categories of the sample products in PlanogramBuilder: sample_files/assortment_analysis/assortment_analysis_sample_source_file.xlsx
Supported columns (Assortment file)
Reference: a compulsory column with this header name.
- Supported values on each line: Reference value of a product existing in the database.
- Example: zv-0000000028
Loading the assortment file
Click on Browse.
- Select your assortment file on your PC.
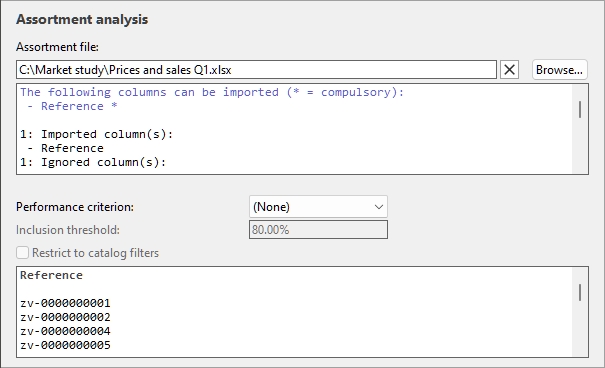
- The path and name of the currently loaded assortment file is displayed in the text box.
- An import log is displayed in the text area just below the filename, so you can verify if the imported data is correct.
- In blue text, to help you prepare your input spreadsheet: list of supported columns
- In black text, once you’ve imported a file: list of imported and ignored columns.
- In red text, once you’ve imported a file: list of errors
- Click on the red cross button if you want to unload the current file.
Notes:
- The analysis is performed as soon as a valid file is loaded.
- The file path persists over PlanogramBuilder sessions.
- PlanogramBuilder provides an automatic reload of the local data files. This is useful since you can keep the Excel application open to edit your local data, save changes in Excel with Ctrl-S and instantly reflect the changes in PlanogramBuilder.
Tips:
- You can select (Ctrl + a) and copy (Ctrl + c) text from the import log. This is also available from its contextual menu.
- You can zoom in/out in the log window using Ctrl + mouse wheel. The default zoom level is reset on task switch.
Parameters (Assortment analysis)
The following parameters let you customize the analysis.
Performance criterion
A drop-down list with a choice of criteria to rank the products.
- Supported values:
(None) (Assortment analysis)
This choice lets you create a sub-assortment of your database based on Assortment file, but without any analysis. The products are listed by Reference alphabetically in Results log (Assortment analysis).
Note: requires Assortment file
Tip: To work on a subset your database in the product catalog, use this method combined with Assortment (mode in Catalog of products).
Markup (Assortment analysis)
This choice sorts the products by their markup value based on the quantity sold.
|
|
|
|
× |
|
|
= |
Markup (Assortment analysis) |
Note: requires Assortment file, Price list file and Sales figures file
Quantity sold (Assortment analysis)
This choice sorts the products by quantity of items sold defined in Sales figures file, not taking into account the monetary value of each item. The product with the highest number of units sold is ranked first and the lowest number of units sold is ranked last.
Note: requires Assortment file and Sales figures file
Retail value (tax excl.) (Assortment analysis)
This sorts the products by the amount of money generated from sales before tax. The product with the highest sales revenue is ranked first and the one with the lowest sales revenue is last.
|
|
|
|
× |
|
|
= |
Retail value (tax excl.) (Assortment analysis) |
Note: requires Assortment file, Price list file and Sales figures file
Retail value (tax incl.) (Assortment analysis)
This sorts the products by the amount of money generated from sales including tax. The product with the highest sales revenue is ranked first and the one with the lowest sales revenue is last.
|
|
|
|
× |
|
|
= |
Retail value (tax incl.) (Assortment analysis) |
Note: requires Assortment file, Price list file and Sales figures file
Inclusion threshold
This parameter lets you specify a percentage threshold defining which products are valuable enough to keep.
This type of analysis uses what is known as the Pareto principle to identify the vital few versus the trivial many products. Applied to sales, this principle states that the vast majority of your results are generated by a small percentage of products.
- Supported values: positive numeric percentage value [0-9 and decimal point] (0%-100%)
- Default value: 80%
- Example: 100%
Inclusion threshold represents the cumulated percentage values you want to reach to decide which products are parts of the vital few. A ratio of 80/20 (80% value) is often used but you can enter any desired percentage value.
Example of an analysis:
With 80% and using Retail value (tax excl.) (Assortment analysis) as performance criterion, the analysis works as follows:
- The products listed in your Assortment File are analyzed.
- They are ranked by Retail value (tax excl.) (Assortment analysis).
- Starting with the highest-ranking product, Retail value (tax excl.) (Assortment analysis) are added for each product until their sum reaches the 80% threshold. These products are judged above threshold by the analysis (the vital few).
- The remaining products, for which the sub-total of Retail value (tax excl.) (Assortment analysis) makes up 20% or less of the total are judged below threshold by the analysis (the trivial many).
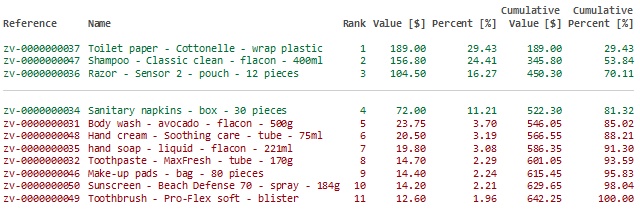
Here is an analysis result log for the above example with 11 products. In this example, 4 products (in green) are enough to reach at least 80% of the revenue. The remaining 7 products (in red) amount to less than 20% of the revenue:
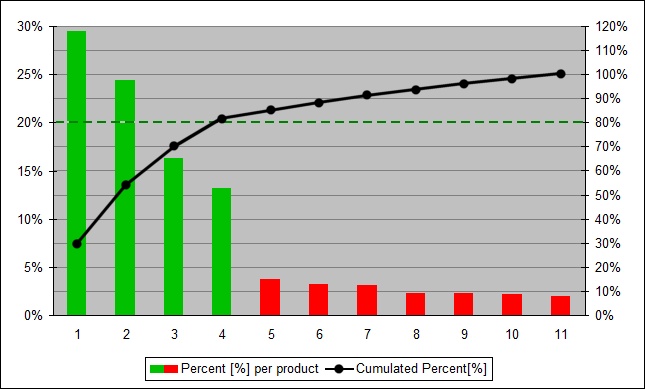
Below is a typical Pareto graph illustrating the same example :
Restrict to catalog filters
Toggles limiting the analysis to the products currently filtered by Classification hierarchy (Catalog of products) in Catalog of products.
- Supported values:
- Checkmarked: the analysis is done only on the products in Assortment file belonging to the classification level currently selected in Catalog of products. Products not in the current selected level are ignored by the analysis.
Tip: Use this method to analyze sales for any category, brand or other item classification properties you have defined. For example, select any category in the product catalog and see right away how products rank just within this category.
- Not checkmarked: the analysis is done on all the products in Assortment file. In this case the assortment analysis results will be the same no matter what classification level is selected in Catalog of products.
- Default value: Not checkmarked
Results log (Assortment analysis)
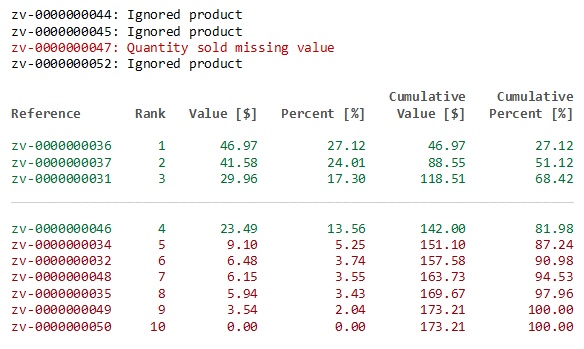
After loading Assortment file, the results of the analysis are shown in the log area, listing one product per line.
- In black text with no result: ignored products (excluded by Restrict to catalog filters)
- In red text with no result: ignored products with missing values.
- In green text with results: products within Inclusion threshold.
- In red text with results: products outside Inclusion threshold.
Tip: you can zoom in/out in the log window using Ctrl + mouse wheel. The default zoom level is reset on task switch.
Notes:
- Undefined metrics are displayed with the N/A value.
- Metrics based on incomplete data have the (MD) (missing data) value appended to the calculated value.
Log context menu (Assortment analysis)
Right-click in the log area to see its context menu.

The following tools and options are available:
- Columns: lets you choose the columns to display in the log:
-
- Reference: a column with Reference of each product.
- Name: a column with Name (Item properties) of each product.
- Rank: a column showing the ranking of each product in the analysis.
- Value: a column with the result of the analysis for each product.
- Percent: a column with the result of the analysis, in percentage of the total of all analyzed products.
- Cumulative Value: a column with the result of the analysis for the cumulated values of analyzed products up to the current product in the list.
- Cumulative Percent: a column with the result of the analysis for the cumulated values of analyzed products up to the current product in the list in percentage of the total of all analyzed products.
- Copy: lets you copy selected text from the log (Ctrl + c).
- Select all: selects all the text in the log (Ctrl + a).
Tip: To preserve the text colors and format when you paste the analysis results in another application, choose the paste method labeled Rich Text Format, formatted text RTF or Keep format.
Assortment (mode in Catalog of products)
In addition to viewing the results in Results log (Assortment analysis), you can also use the assortment analysis results to rank and filter items in Catalog of products.
This is very useful to help you easily find the best performing products while you are building up your planogram.
- Supported values:
- Checkmarked: the analysis results are not displayed in Catalog of products. In this mode, the catalog displays a reflection of your assortment analysis results:
- Products are sorted from the highest to the lowest performer.
- Their respective performance percentages are displayed in blue text below the product thumbnails. The percentage values will differ if Restrict to catalog filters is checkmarked or not checkmarked.
- Low performing products (outside the specified Inclusion threshold) are hidden from the catalog listing.
- Not checkmarked: the analysis results are not displayed in Catalog of products.
- Default value: Not checkmarked
Instructions:
- Perform Assortment analysis as instructed in the above sections.
- Switch to the task: Products.
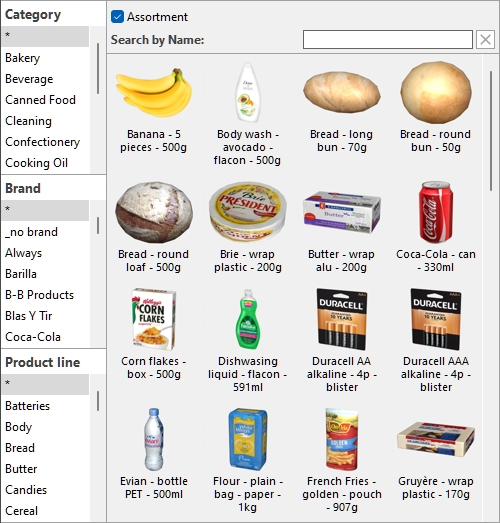
- Check the checkbox named Assortment. It is located just above the search filter and appears only when Assortment analysis is active.
Notes:
- In this mode, you can still use Search by text (Catalog of products) within the displayed products.
- Just uncheck Assortment to display the product catalog with all products and without taking into account the results of Assortment analysis.
- Undefined metrics are displayed with the N/A value.
- Metrics based on incomplete data have the (MD) (missing data) value appended to the calculated value.